I have started working on the implementation of my plan, [1] and now I attached a resulting image came from it.

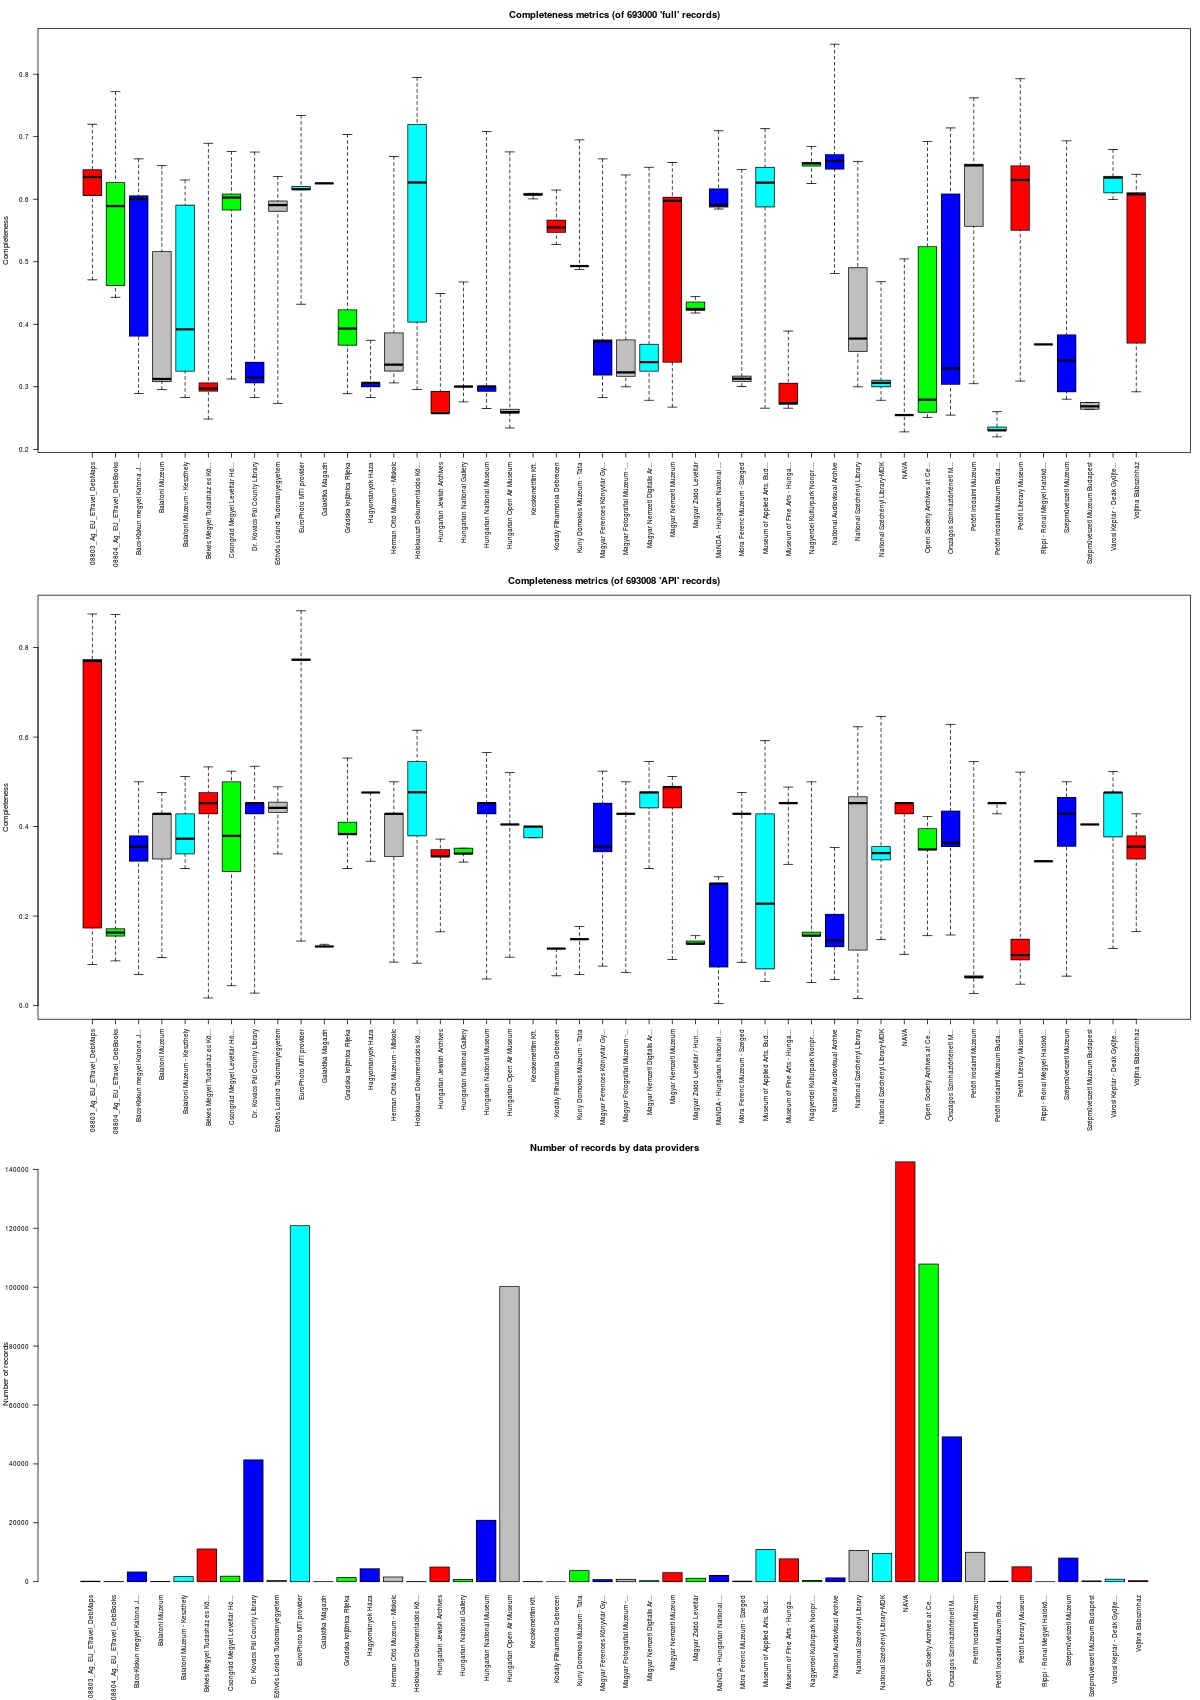
What you can see in the image is three charts. The first one contains the completenes boxplot of the full Europeana records, the second one is the same report for the search API records, and the last one shows the number of records per data providers.
I should start somewhere so I collected all the records match the query COUNTRY:hungary which produces 690K records, a bit more than 1,5% of all Europeana records. I used the API, and saved two files: one for the full records, one for the search API records. Each files contain one record per line in JSON format, but I removed the metadata type elements of the API, such as the number of records, the number of requests etc. I used api2demo as API key. Sometimes I had to stop the process, and thus at the end there is a small difference in the number of records in each files. To harvest the records took 1,5 days, which is pretty slow for this purpose.
I have created two schema representation files, which contained the elements and their types. I should note, that the API documentation at the Labs site is a bit outdated, it seems, that there are new fields which are not documented, and some type note is false. With a somewhat fresh eye, it is clear, that there are some inconsistency between record and search API result format, for example there are 3 different way how to present language variations.
The measure of the completeness is simple: I count the existing fields, and the total number of the fields. If an existing field contains multiple instances, then I give it more weights. There could be some more tweaking in this calculation, but it was good for start.
I run the two calculation (records again records schema, and search records against search record schema) in a batch process based on Hadoop. In case you don’t know Hadoop: it is the other invention of Doug Cutting, the inventor of Apache Lucene (the basis of Solr, Europeana’s search engine), for distributed computations. I let the user to scale the application by distribute the computations over several commodity machines. It splits the input file into smaller chunks and sent to different nodes along with the definitions of tasks to run on the data to work paralelly by implementing the MapReduce paradigm.
The program right now produce a flat file containing name value pairs, in this case the data provider name and ID of the record as key, and the result of the calculation which is a number between 0 and 1 where 0 means the worst possible record having no relevant field, and 1 is the exemplar record having all the schema fields.
Then I run an R script with these result which produces the boxplot charts. The general feature of boxplot is, that it shows the distribution of the “quartiles”: if we separate the range of the values into 4 equal parts, the lower and top quarles displayed with dotted lines, the inner quartiles form a box, and a line shows the mean. The result shows the distribution of typical values, ad the extreme values. If the box is small it means, that the records are similar in terms of completeness, if the box is large it means, that the records are different: there are better and worse records and so on.
There were some conclusions when I saw the charts:
1) there is at least one collection where the box is too condensed, and it might mean, that the records are created the very same way, and they might contains same information. I have checked this collection, and it turned out, that some of the fields which were the basis of enhancements are really the same, so they get the same Place and Concepts - so enhancement has an effect which enlarge similarities of some fields. I guess I should add a different completeness measurement without these entities.
2) the full and search record’s completeness numbers are quite different. I am thinking about the reasons (I know some cases where the Solr index had and still has errors), but I should investigate it more.
I’ve put the source code of the Hadoop part into my GitHub account: https://github.com/pkiraly/europeana-qa
These are just the baby steps, and there are lots on my plate, so I’ll go further. If you interested, from time to time I will create such a reports - maybe in a different form. If you have any suggestions or notice, please let me know.
Cheers, Péter
Notes
[1] My research plan’s title is ‘Metadata Quality Assurance Framework’, and is about how to measure the “goodness” of metadata records in cultural heritage databases, such as a digital library, a traditional library catalog, or even in research data archives.