The second report describing the process of harvest with tricks and tips, the running of full ‘completeness’ analyses, and the first visible results.
Harvesting
During the autumn Europeana launched its OAI-PMH server (see details at Europeana Labs site,) and I started using it intensively. I have created a client project for harvesting all records. Soon it turned out, that sometimes the server is not responsive because it lost the connection to the Solr server behind it. Once the connection is lost we can not really continue the harvest (once it stopped you should start from the very beginning). I modified the client to give extra tries in case of errors. It turned out, that it is not enough, there are cases when even the 4th try were failed. With this approach I was able to harvest about 10 million records as the maximum and it took several days. If it would have gone smoothly the total harvest would have taken about 13 days. Fortunately the OAI-PMH service supports sets, and each OAI-PMH set correspond to a Europeana dataset or collection, which is a unit of ingestion. (Europeana has roughly a monthly cycle of data ingestion where it collects the data from the intermediate level data aggregators. The data aggregators collect data from data providers - the institutions who own or curate the digitized objects and create metadata records.)
I followed a new approach: harvesting by sets instead of harvesting the whole database. It has the advantage in that if it fails, you don’t loose everything, and another one: it can be run in parallel, harvesting different datasets in different threads. I have implemented it in a very simple way. A text file contained all the dataset names - one per line. There was a dispatcher script that was called every minute by cron (the standard scheduler tool in Linux machines), which checked how many harvesters are running (ps aux | grep "[o]ai2json.php" | wc -l), and if it is less than the maximum slots available, it picked up the top line and launched a new harvester with the name of the dataset. It worked well, but not perfectly. It turned out, that when the client almost reached the supposed end of harvest (unfortunately the OAI-PMH server doesn’t tell you the total number of records, but you can figure it out with the help of Europeana REST API by faceting for europeana_collectionName field here) it starts responding without giving back any record, but keeps the containing resumption tokens (which is the standard’s signal denoting that there are more record - if there is no resumption token in the response it means, that it is the end of the harvest). For each set there were thousands of empty responses before the actual ending of the harvest. It turned out moreover that the harvested number of records did not correspond to the number reported by the API. And there were another problem as well: if a set name contains any special characters (space, ampresand or UTF-8 characters) the server gives back an error.
When I reported these problems to Europeana they were nice enough to send me the list of IDs of all Europeana records. The approach this time was to compare the IDs of the downloaded records with this ID list, and harvesting only the missing individual records (via the GetRecord verb). This went perfectly, but more slower than the previous methods.
At the end I had a bit more than 47 million records in JSON. JSON? How come, since OAI-PMH returns XML? Well, that’s true, but JSON is a more compact format, requires less space, and since I started with the REST API, which produces JSON response and the available space on the machine that I was working with was a critical issue I decided not to save the XML response but transform each of the records to JSON files as one record per line and each file represents a dataset. The total size takes roughly 400 GB.
Measuring completeness
In October 2015 Valentine Charles from the Research and Development Team of Europeana published a set of criteria for the completeness measurements.
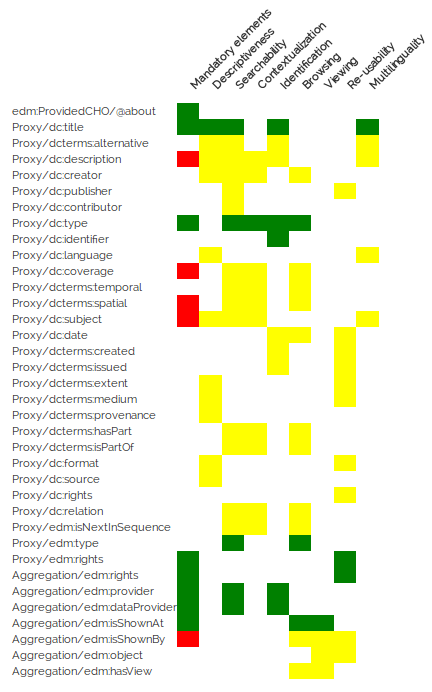
She defined the following dimensions of completeness:
- Descriptiveness: a complete EDM record should contain rich descriptive information
- Searchability and Findability: a complete EDM record should have all the properties that correspond to Europeana’s users search pattern.
- Contextualisation: a complete EDM record should have all the properties that provide contextual information or can trigger the creation of contextual information (e.g. enrichment framework).
- Identification: a complete EDM record should have all the properties that will allow a user to distinguish a CHO from another one within Europeana.
- Browsing: a complete EDM record should have all the properties that will allow a user to navigate within a graph of CHO through a series of relationships.
- Viewing: a complete EDM record has all the properties that allows a user to view, play, listen a given CHO
- Re-usability: a complete EDM record has all the properties that allows a user to know how to re-use a CHO
- Multilinguality: a complete EDM record should have language information
Each dimension (or functionality) covers several fields of the Europeana Data Model (mainly from the “Proxy” part, which is the core of the EDM records). In current iteration I measured the existence of those fields, and calculated the ratio of the existing and required fields. So if all the fields are presented, then the result will be 1, if only a half of it, then 0.5.
In the previous approach the program iterated on all fields within the document, and since Valentine’s table did not covered all the fields only the most important ones, I did not wanted to follow that approach. I needed something like the XPath for XML files: an addressing method with which I can check some selected leaves in a tree structure. Fortunately, the Swedish Jayway software development company published an Open Source Java implementation of Stefan Goessner’s JsonPath which does exactly what I needed.
I used GWDG’s machine for this purpose which is tuned for high performance computing, but lacks enough disk space for the purpose, so I have to upload compressed files to the server, decompress them, upload to the HDFS file system, run the Hadoop code, save the result, and delete the file. It took 2 days of which half were spent on file operations. In the meantime, I received access to a Europeana machine which has enough space so we expect the next iteration will take only one day or even less. The results of the calculations are saved to Comma Separated Value files, something like these lines:
"Bildarchiv Foto Marburg",08501/Athena_Update_ProvidedCHO_Bildarchiv_Foto_Marburg_obj_00000001_192_356,0.472222,0.692308,0.545455,0.388889,0.272727,0.600000,0.285714,0.500000,0.500000,0.400000
"Bildarchiv Foto Marburg",08501/Athena_Update_ProvidedCHO_Bildarchiv_Foto_Marburg_obj_00000003_192_358,0.444444,0.692308,0.454545,0.333333,0.181818,0.600000,0.214286,0.500000,0.500000,0.400000
"Bildarchiv Foto Marburg",08501/Athena_Update_ProvidedCHO_Bildarchiv_Foto_Marburg_obj_00000004_192_359,0.472222,0.692308,0.545455,0.388889,0.272727,0.600000,0.285714,0.500000,0.500000,0.400000
"Bildarchiv Foto Marburg",08501/Athena_Update_ProvidedCHO_Bildarchiv_Foto_Marburg_obj_00000004_1_201_181,0.472222,0.692308,0.545455,0.388889,0.272727,0.600000,0.285714,0.500000,0.500000,0.400000
You can find the source code of this part in the europeana-qa project on Github, and you can find there installation and usage notes as well.
Statistical analyses

The statistical analyses are written in R language scripts. At current iteration there are two scripts: one creates and saves three graphs (a barplot, a boxplot and a quantile-quantile plot) for each of the dimensions mentioned above (descriptiveness, searchability etc.), the other exports some descriptive statistics (minimum, maximum, mean, median, standard deviation etc.) to a JSON file. The scripts run on a set level. In the future I will create the same analyses on a collection level, which could be more important for the data creators.
You can find the source code of this part in the europeana-qa-r project on Github.
Web interface

You can access the quality reports temporarily in a GWDG machine. Since right now this part is the less elaborated portion of the project, it will be changed soon. Now it has two parts:
- a dataset level summary which contains for each dimensions the list of fields covered, the descriptive statistics, the graphics, links to record-level analysis of records having the “best” and “worst” score in that particular dimension
- a record level summary which visualizes the existing and missing fields, the completeness measurements, links to different manifestations (portal, API, OAI-PMH) of the record, and the full JSON code of the metadata record. It also has a search form. So you can check any Europeana record.
You can find the source code of this part in the europeana-qa-web project on Github.
Events
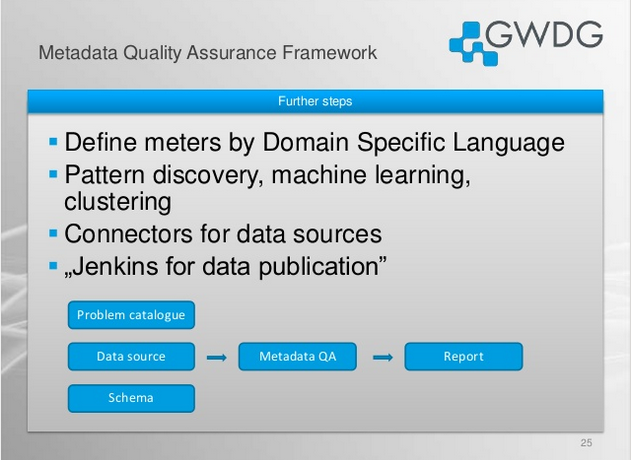
Regarding to this project there were some important happenings recently. The first one is that within Europeana a special working group concentrating on metadata quality is forming and I was asked to participate. The group is launching very soon. However, I cannot show any public links yet. The other was a presentation I held as part of GWDG eScience Group’s Oberseminar. You can find the slides here.

Conclusion and next steps
Downloading all the Europeana records is on the wish list of several projects. I hope, that my feedback helps Europeana to improve the OAI-PMH service to fulfill this wish. Having all the records will enable me to concentrate more on the measurement and analysis part. I should finish generating the analyses (on the web you can find only some dataset’s reports). The web part now shows HTML pages, and I would like to start building a real API, which combines some features of the existing Europeana REST API (mainly the searching) with the results of the analyses. For example: you could run a search and this API would give you the statistics of the resulting set. The API would be useful to share completeness metrics with Europeana and reuse the results in the relevance ranking (to place the “good” records to the top of the hit list). And finally it could be useful for the data providers to get feedback on their cataloging costumes.
Important links
Update (2015-01-18)
After writing the post ran both the measurements and statistical analyses parts on the machine Europeana provided me access to. Here are the results:
| feature | GWDG machine | Europeana machine |
|---|---|---|
| processor | AMD Opteron 62xx | Intel Quad-Core i7-4770 |
| nr. of processors | 8 | 8 |
| RAM | 16 GB | 32 GB DD3 |
| virtualization | yes | mo |
| measurement time | 44.5 hours | 6 hours |
| statistics time | 13.5 hours | 4.5 hours |
In the measurement ran at GWDG the process contained the tasks of copy of compressed files, decompressing them, uploading to and finally deleting from the HDSF (Hadoop Distributed File System) storage, while on the Europeana provided machine I were able to upload all the files at once. However if I should repeat the steps again (and I will), then I have to follow roughly the same process, and it will require the same amount of time.